A big thank you to the 88 people who participated in the Love Data Week 2019 “Data in Everyday Life” online activity! About 70% of responses came from academics (faculty, lecturer, research) and staff, with the rest from undergraduate and graduate students. Some other highlights:
Who drinks more coffee?
About 40% of each group (academics/staff, students) responded that they didn’t drink coffee on a daily basis, which was higher than we expected! Among all those who drink coffee, people reported drinking about 2 cups of coffee per day, on average.
Are we getting enough sleep?
The CDC recommends that adults should get at least 7 hours of sleep a night. On average, UC San Diego affiliates are getting about an hour less than that, with 59% of respondents reporting “short sleep,” which is anything less than 7 hours.
How does this compare to the rest of the state? Well, in 2014, about 1/3 of California adults reported getting less than 7 hours of sleep a night. With over half our affiliates reporting short sleep, we’ve got some catching up to do with the rest of the state to be well-rested!
Commuting
 Just over half of respondents reported driving themselves to campus and 20% of respondents used public transportation. The most common commute time was 16-30 minutes. We didn’t have enough responses to dig further into academics/staff vs. students in terms of commute time by transportation method without potentially compromising respondent privacy.
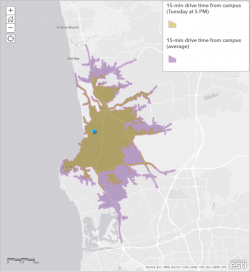
Using GIS (geographic information system), we can calculate drive-time analyses. For the map to the right, we ran a drive-time analysis to understand the geographic extent someone could drive in 15 minutes. But, we know that distance someone can drive in 15 minutes varies greatly from the middle of the day to the evening commute!
The map shows the average 15-minute commute in (purple) and the Tuesday 5 PM commute (yellow).
TV watching
 Sitcoms, news shows, dramas, and reality TV were all represented among the favorite shows listed.
Netflix was the most common way people reported watching TV, followed by Amazon. More people watched Netflix, but not Amazon, than vice versa (i.e., most people who watched TV using Amazon also reported watching with Netflix, but the reverse was not true).
Paying attention
Be honest: did you know the secret password? Probably not! Only 33% of respondents correctly answered “library” for the password, meaning only one in three people comprehensively read our data privacy policy landing page. We’re glad you trusted us enough to not read it, but it’s always a good idea to at least skim the data privacy policy. If you missed the Love Data Week data privacy talks by Campus Privacy Officer Pegah Parsi, you can learn more about data privacy from the campus Privacy Office.

